 Zelandakh, on 2015-November-10, 04:00, said:
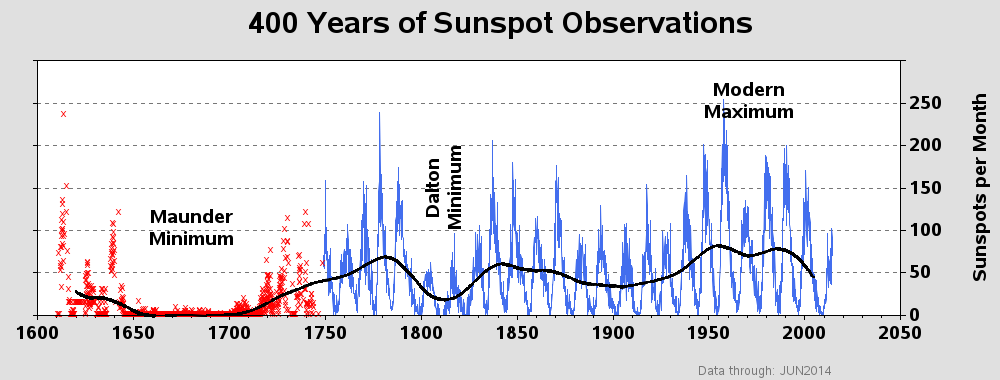
Maybe a good idea to post what this actually shows since it bears little to no resemblance to the Sunspot Number Version 2.0, currently recognized as the most accurate measure of sunspot activity over the last 400 years. If, as seems likely, it mixes in additional series then hrothgar's criticism is more than justified - I can show a correlation between dog poo and temperature with enough series in the mix. Note that this was within the criticisms of the first link I provided to you, so I would suggest you go back and read that as I really cannot be bothered to type exactly the same things out time after time. This is, sadly, also a feature of "discussions" with AIU.
You did not answer my question. So, let’s start again. When you have a set of data and want to figure out what they are you start by elaborating a theory. From that theory you elaborate a mathematical formula from which you can generate data. If the generated data has no correlation with the observed data the theory is rejected as false. If the 2 sets of data has a high degree of correlation then you accept that the theory is right. Mind you I said accept, not proven. There is a difference between accepting a theory because you can’t disprove it and saying that it is proven.
Now, as for the correlation between SSN and temperature anomalies
TA= the predicted Temperature Anomaly
Cos = the cosine in radians, * = multiplication, ^ = exponent operator, Σ = summation, a,b,c,d,e = constants
TA= d*[Σcos(a*SN)-Σb*SN^c]+e
From month 1 to the present. The calculation starts in January of 1880.
The correlation was made using a non-linear time series least squares optimization over the entire data range from January of 1880 to February of 2013. The Proportion of variance explained (R^2) = 0.8212 (82.12%)
The Parameters for the equation are:
a= 148.425811533409
b= 0.00022670169089817989
c= 1.3299372454954419
e= -0.011857962851469542
f= -0.25878555224841393
The summations were made over 1598 data months therefore use all the digits in the constants to ensure the correlation is maintained over the data set.
Now contrary to what has been said, this is not a fly in the wind 5th degree polynomial fit and it follows exactly what was said before, the scientific protocol.
So I ask you again
As a math graduate, knowing the meaning of correlation, what is you professional take on these correlations ?
 Help
Help


